

For small businesses in bustling local markets like Surrey, from Guildford to Epsom, implementing effective competitor analysis techniques can reveal untapped opportunities and protect you from unforeseen threats.
To effectively dissect the competitive landscape, it’s essential to start by building a robust competitor analysis framework that systematically gathers and organises information. This ensures your efforts are focused and efficient, rather than a random collection of observations. Without a solid structure, vital insights can be missed, leaving your business vulnerable.
This article will equip you with the frameworks and step-by-step instructions needed to turn raw data into a strategic advantage. We will explore 10 powerful and actionable competitor analysis techniques that move beyond simple observation. You will learn to:
- Identify your competitors’ strengths and weaknesses.
- Analyse their market positioning, pricing, and customer strategies.
- Uncover gaps in the market that your business can fill.
- Benchmark your performance against key players in your industry.
By the end of this guide, you will have a comprehensive toolkit to make smarter, data-driven decisions that foster sustainable growth and help you secure a genuine competitive edge. Let’s begin.
- 1. SWOT Analysis for Competitors
- 2. Porter's Five Forces Analysis
- 3. Competitive Benchmarking
- 4. Digital Footprint Analysis
- 5. Perceptual Mapping
- 6. Feature Comparison Matrix
- 7. Customer Journey Mapping for Competitors
- 8. Financial Performance Analysis
- 9. Strategic Group Mapping
- 10. Win/Loss Analysis
- Competitor Analysis Techniques Comparison
- From Analysis to Action: Building Your Winning Strategy
1. SWOT Analysis for Competitors
A classic for a reason, the SWOT analysis is a foundational strategic planning framework. While often used for self-assessment, applying it to your rivals is one of the most powerful competitor analysis techniques you can employ. It provides a structured, 360-degree view of a competitor’s position by examining their internal capabilities and external market environment.
This method involves dissecting a competitor into four distinct quadrants:
- Strengths (Internal): What advantages do they have over others? Think strong brand recognition, a loyal customer base, proprietary technology, or an efficient supply chain.
- Weaknesses (Internal): Where are they vulnerable? This could include poor customer service reviews, outdated technology, high employee turnover, or a narrow product range.
- Opportunities (External): What external factors could they exploit to their advantage? Consider emerging market trends, new technologies, or gaps in the market left by others.
- Threats (External): What external factors could undermine their success? This includes new regulations, a changing economic climate, negative press, or the rise of a disruptive new competitor.
For a local business in Surrey, a SWOT analysis could be used to evaluate a rival service provider. For example, a local plumber might analyse a competitor, identifying their well-established local reputation (Strength), their lack of an online booking system (Weakness), the growing demand for eco-friendly heating solutions (Opportunity), and the threat of a new, low-cost national franchise entering the area (Threat). This structured insight helps you pinpoint exactly where to focus your efforts to gain a competitive edge.
Key Components of a Competitor SWOT
To effectively structure your analysis, it’s crucial to distinguish between internal factors your competitor can control and external factors they cannot. The following infographic summarises the core areas of focus.
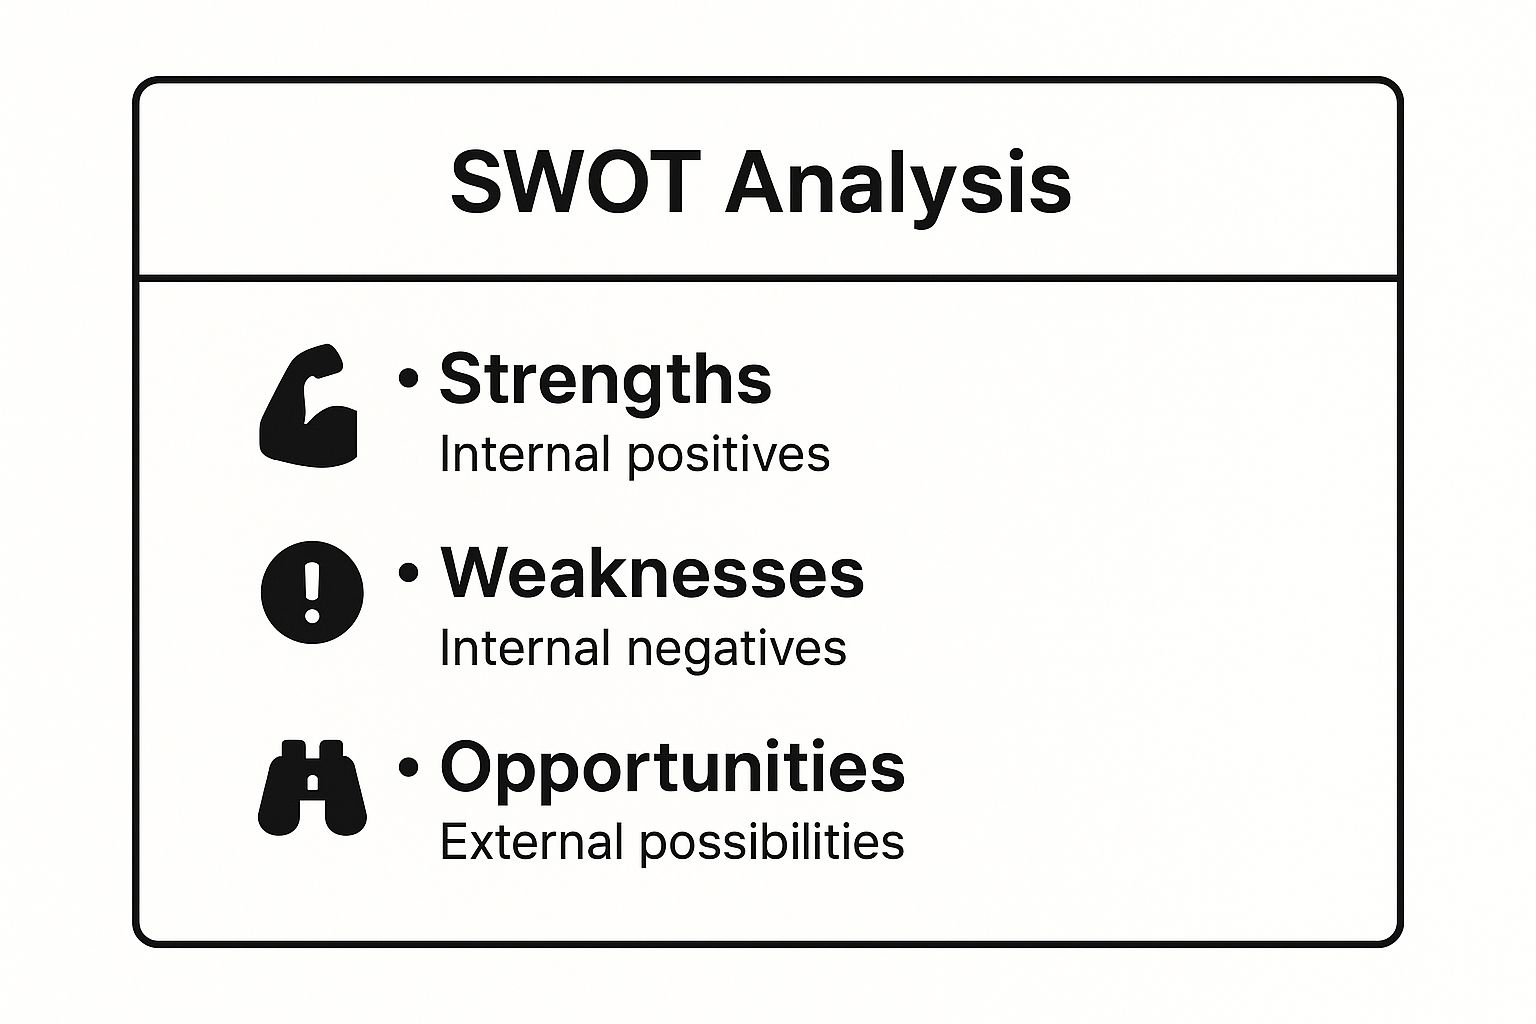
This visual breakdown clarifies that a thorough analysis balances a competitor’s inherent capabilities (Strengths and Weaknesses) with the wider market dynamics (Opportunities).
Actionable Tips for an Effective SWOT Analysis
- Be Objective: Use real data, not just assumptions. Look at customer reviews, financial reports (if public), and their marketing materials.
- Stay Current: Markets change quickly. A SWOT analysis isn’t a one-time task. Revisit it quarterly or biannually to stay on top of shifts in your competitor’s strategy or the market itself.
- Focus on Action: Every point you list should lead to a question: “How can we leverage this weakness?” or “How can we defend against this strength?” The goal is to inform your own strategy.
By systematically evaluating your competitors through this lens, you move beyond simple observation to strategic planning, making it an indispensable tool for any small business owner looking to grow.
2. Porter’s Five Forces Analysis
Instead of zooming in on a single competitor, Porter’s Five Forces analysis lets you zoom out and assess the entire industry landscape. Developed by Michael E. Porter, this framework is one of the most respected competitor analysis techniques for understanding the underlying power structures in an industry. It helps you determine the attractiveness and potential profitability of your market by examining five key competitive pressures.
This method evaluates the competitive intensity by analysing these five forces:
- Competitive Rivalry: How intense is the competition among existing players? A market with many similar-sized competitors, slow industry growth, and high exit barriers will have fierce rivalry.
- Supplier Power: How much control do suppliers have over prices? If there are few suppliers of a critical input, they hold significant power, which can squeeze your profit margins.
- Buyer (Customer) Power: How much influence do customers have on pricing? When buyers have many choices or can easily switch to a competitor, their power is high.
- Threat of Substitution: How likely are customers to find a different way of doing what you do? This isn’t about switching to a direct competitor but finding an alternative solution, like a local homeowner choosing DIY instead of hiring a tradesperson.
- Threat of New Entry: How easy is it for new businesses to enter your market? High barriers to entry, such as significant startup costs or strong brand loyalty, protect existing businesses from new challengers.
A Surrey-based coffee shop could use this model to understand its position. The Competitive Rivalry is high due to numerous local cafés. Buyer Power is also high, as customers have many options. Supplier Power might be moderate, depending on their relationship with local bakeries and coffee roasters. The Threat of Substitution is real (people making coffee at home), and the Threat of New Entry is high, as starting a small café has relatively low barriers. This analysis reveals the tough competitive dynamics and highlights the need for strong differentiation.
Key Components of a Porter’s Five Forces Analysis
To perform this analysis effectively, you need to systematically evaluate the strength of each force. This moves beyond a simple competitor list to a strategic understanding of the entire market’s structure and profitability. The framework helps you identify where power lies in your industry.
This visual guide helps to frame your thinking around each force, ensuring you consider the various factors that determine the overall competitive pressure on your business.
Actionable Tips for an Effective Porter’s Five Forces Analysis
- Rate Each Force: For a clearer picture, score each of the five forces on a scale (e.g., 1 for low, 5 for high). This quantitative approach helps you compare the relative pressures and pinpoint the biggest challenges and opportunities.
- Stay Dynamic: Industries are not static. Digital disruption, new regulations, or shifts in consumer behaviour can alter the balance of power. Revisit your analysis periodically, especially when you notice significant market changes.
- Inform Your Strategy: The goal is to find a strategic position where your business is best defended from these competitive forces. For example, if buyer power is high, focus on building loyalty through exceptional service or a unique product that they can’t get elsewhere.
By using this framework, you can anticipate shifts in competition, understand the drivers of industry profitability, and make more informed strategic decisions to secure your market position.
3. Competitive Benchmarking
Competitive benchmarking is a systematic process of measuring your company’s performance, processes, and practices against those of your industry’s leaders and direct competitors. Popularised in the 1970s by Xerox, this technique moves beyond simple observation to data-driven comparison, helping you identify performance gaps and pinpoint specific areas for improvement.
This method involves a structured comparison of key metrics. It answers the fundamental question: “How do we stack up against the best?” The goal is to learn from others’ successes and failures to enhance your own operations. It’s about setting performance targets based on proven results rather than internal assumptions.
- Identify Key Metrics: First, decide what to measure. This could be anything from website conversion rates and customer acquisition costs to operational efficiency or customer satisfaction scores.
- Select Competitors: Choose who to benchmark against. Include both direct rivals (other local businesses in your field) and industry leaders who may not be direct competitors but set the standard for excellence.
- Gather Data: Collect performance data on your chosen metrics for both your business and your competitors. This can come from public reports, third-party data providers, or market research.
- Analyse and Act: Compare the data to identify gaps. Use these insights to set realistic improvement goals and adjust your strategy accordingly.
For instance, a local café in Surrey might benchmark its average customer spend and queue times against a successful nearby competitor. Simultaneously, it could look to a major chain like Costa Coffee to benchmark the efficiency of its mobile ordering and loyalty programme. This multi-layered approach provides a clear, actionable roadmap for growth, making it one of the most practical competitor analysis techniques available.
Key Components of Competitive Benchmarking
To ensure your analysis is effective, focus on a balanced mix of metrics that reflect different aspects of business performance. You should compare your internal processes and outcomes against the external standards set by others.
This visual guide helps clarify the core idea: measuring your internal reality against the best external examples to drive strategic improvement.
Actionable Tips for Effective Benchmarking
- Start Small: Don’t try to measure everything at once. Begin by focusing on 3-5 critical Key Performance Indicators (KPIs) that are most relevant to your business goals.
- Use Objective Data: Rely on third-party data sources, analytics tools, and market research to ensure your comparisons are impartial and accurate.
- Benchmark Broadly: Look beyond your direct local competitors. Analyse industry leaders to understand what “best in class” truly looks like, even if they operate on a different scale.
- Integrate Findings: Benchmarking isn’t just a research exercise; it should directly inform your business plan. Use the insights to refine your approach with one of several small business growth strategies.
By regularly comparing your performance to others, you create a continuous feedback loop that fosters innovation and helps you stay competitive in a dynamic market.
4. Digital Footprint Analysis
In today’s market, a competitor’s online presence is their digital storefront, recruitment hall, and community hub all in one. A Digital Footprint Analysis involves a comprehensive examination of this presence, covering everything from their website’s user experience and search engine rankings to their social media engagement and content marketing efforts. This is one of the most revealing competitor analysis techniques for understanding how rivals attract, engage, and convert customers online.
This method requires you to map out a competitor’s entire online ecosystem. This includes:
- Website & SEO: How well does their site perform? Is it mobile-friendly? What keywords do they rank for?
- Content Marketing: What topics do they cover in their blog or resources? How frequently do they publish?
- Social Media: Which platforms are they active on? What is their engagement rate and follower growth?
- Digital Advertising: Are they running paid ads on Google or social media? What messaging are they using?
For a B2B consultancy in London, this could mean analysing a competitor’s LinkedIn content to understand their thought leadership strategy. Similarly, a fashion brand in Manchester might track a rival’s Instagram, noting their influencer partnerships and campaign themes. This granular view reveals their digital strategy, audience engagement levels, and overall online market position. For a deeper dive into understanding your rivals’ online advertising, explore how to conduct effective PPC competitor research to outperform rivals.
Key Components of a Digital Footprint
To effectively map out a competitor’s online activity, it is vital to analyse both their owned assets (like their website) and their presence on third-party platforms. The following infographic highlights the core areas to investigate.

This visual guide shows that a complete analysis covers everything from their search visibility and content strategy to their paid media and social media activity.
Actionable Tips for an Effective Digital Footprint Analysis
- Use the Right Tools: Leverage platforms like Ahrefs or SEMrush for SEO insights, SimilarWeb for website traffic data, and the Facebook Ad Library to see current social media ads.
- Set Up Alerts: Create Google Alerts for your competitors’ brand names. This ensures you are notified of any new content, news mentions, or PR activity as it happens.
- Track Content Calendars: Monitor their blog and social channels for a month to identify content themes, posting frequency, and popular formats. This helps you spot gaps you can fill.
- Become a ‘Ghost’ Customer: Sign up for their newsletter, follow them on social media, and go through their sales funnel. This provides first-hand insight into their customer journey and marketing automation.
By systematically dissecting your competitors’ online activities, you can identify their digital strengths and weaknesses, allowing you to build a more effective and targeted strategy to capture market share.
5. Perceptual Mapping
Perceptual mapping, also known as positioning mapping, is a powerful visual technique among the various competitor analysis techniques available. It plots how customers perceive competing brands or products based on two key attributes, such as price versus quality. This method provides an immediate, easy-to-understand snapshot of the competitive landscape, revealing where your brand stands in the minds of consumers relative to your rivals.

The map uses a two-dimensional grid, with each axis representing a significant purchasing criterion. Key applications include:
- Identifying Market Gaps: Unoccupied quadrants on the map can signal untapped market opportunities where no competitor is currently positioned.
- Understanding Competitive Positioning: It clearly shows which competitors are seen as close substitutes and which occupy a unique niche.
- Guiding Brand Strategy: The insights help you decide whether to challenge a direct competitor, reposition your brand, or target an underserved market segment.
- Tracking Brand Perception: Over time, these maps can track how your brand’s perception is changing due to marketing efforts or shifts in the market.
For instance, a local hotel in Surrey could map competitors based on “Luxury vs. Value” and “Modern Amenities vs. Traditional Charm.” This might reveal a gap for a high-value hotel with modern amenities, guiding their next investment or marketing campaign. The visual nature of this analysis makes it an invaluable tool for strategic discussions and presentations.
Key Dimensions of Perceptual Mapping
Choosing the right dimensions (or axes) is critical for a meaningful map. These should be the attributes that matter most to your target customers when they make a purchasing decision. The video below offers a great visual guide on how to construct and interpret these maps effectively.
Understanding how your brand is perceived is the first step in shaping that narrative. Learn more about effective online reputation management for small business to ensure perception aligns with your desired position.
Actionable Tips for Effective Perceptual Mapping
- Select Customer-Centric Attributes: Don’t guess what’s important. Use customer surveys, focus groups, or review analysis to identify the two most critical decision-making factors for your axes.
- Gather Objective Data: To accurately place competitors on the map, rely on market research and customer feedback rather than internal assumptions.
- Create Multiple Maps: Analyse the market from different angles by creating several maps with different combinations of attributes (e.g., price vs. service, convenience vs. selection).
- Look for the Empty Space: The most valuable insights often come from the unoccupied areas on the map. These represent potential market gaps you could fill.
6. Feature Comparison Matrix
A Feature Comparison Matrix is a structured, analytical grid that pits your product or service directly against your competitors on a feature-by-feature basis. This is one of the most granular competitor analysis techniques, ideal for businesses in competitive markets where small differences in functionality can sway a customer’s purchasing decision. It provides a clear, visual, side-by-side overview of who offers what.
This method involves creating a table or spreadsheet where each row represents a specific feature, and each column represents a different company (yours and your competitors). You then systematically go through the list, marking whether each competitor offers that feature.
- Identify Core Features: What are the non-negotiable features customers expect in your industry? List these first.
- List Differentiating Features: What unique or advanced features do you or your competitors offer?
- Include Supporting Attributes: Don’t just stop at product features. Compare pricing models, customer support options, integration capabilities, and user experience ratings.
- Analyse Gaps and Opportunities: The completed matrix will instantly reveal where your offering excels and, more importantly, where it falls short.
For a local Guildford-based project management software firm, a matrix could compare their tool against major rivals like Asana or Trello. They would list features such as task dependencies, time tracking, reporting dashboards, and mobile app functionality. This analysis might reveal their strength in providing personalised, local customer support (a key differentiator) but a weakness in lacking integration with a popular accounting software, highlighting an immediate development opportunity.
Key Components of a Feature Comparison Matrix
To build an effective matrix, you need to think from the customer’s perspective. What do they truly value? The goal is to compare the aspects that most influence their choice. This includes not just what a product does, but how it feels to use and the support behind it.
This visual highlights that a comprehensive comparison goes beyond a simple checklist, incorporating pricing, support, and the overall user experience to build a complete picture.
Actionable Tips for an Effective Feature Comparison
- Prioritise Customer Needs: Focus on the features your target customers care about most. A long list of irrelevant features is useless. Survey your existing customers to find out what’s most important to them.
- Weight by Importance: Not all features are created equal. Assign a weight or score to each feature based on customer priority. This allows you to create a more accurate “total score” for each competitor.
- Stay Updated: Product features change constantly. Schedule regular reviews of your matrix, especially after a competitor launches a new update or product version. The goal is to base your strategy on current, accurate data.
7. Customer Journey Mapping for Competitors
Understanding how a customer interacts with your competitor is one of the most insightful competitor analysis techniques you can use. This method involves mapping out every touchpoint a customer has with a rival business, from the moment of initial awareness right through to post-purchase support and advocacy. It reveals the complete customer experience, highlighting both their strengths and critical weaknesses.
By visualising this path, you gain a deep understanding of how your competitors attract, convert, and retain their customers. The journey typically covers several key stages:
- Awareness: How do potential customers first discover your competitor? Is it through a Google search, a local flyer, social media, or word-of-mouth?
- Consideration: What happens when a lead shows interest? Do they visit the website, read reviews, or call for a quote? What information is provided to help them decide?
- Purchase/Conversion: How smooth is the actual transaction process? Is it easy to book a service, buy a product online, or sign up for a trial?
- Service/Retention: What does the post-purchase experience look like? Is there follow-up communication, support, or a loyalty programme?
- Advocacy: How does the competitor encourage happy customers to leave reviews or refer others?
For instance, a new café in Guildford could map the journey for a well-established competitor. This might reveal that the competitor excels at attracting customers via Instagram (Awareness), but their in-store ordering process is slow and confusing (Purchase), and they have no loyalty scheme (Retention). This insight provides clear opportunities for the new café to differentiate itself by offering a seamless mobile ordering app and a rewarding loyalty card.
Key Components of a Competitor Customer Journey
A successful map documents both the practical steps and the emotional responses of a customer at each stage. It’s about understanding the why behind their actions, not just the what. Focusing on these elements allows you to pinpoint where your competitor is delighting their customers and, more importantly, where they are failing them.
Actionable Tips for Effective Journey Mapping
- Become the Customer: Use mystery shopping to experience the journey firsthand. Call for a quote, sign up for their newsletter, or buy a small product to test the entire process.
- Document Everything: Map out every single touchpoint, both digital (website, emails, social media) and offline (phone calls, in-person visits, printed materials). Note the customer’s likely feelings at each stage: frustration, delight, confusion.
- Identify Moments of Truth: Pay close attention to critical moments where a customer is most likely to form a strong opinion or make a key decision. This is often where competitors win or lose business.
- Look for Gaps: The goal is to find gaps in their experience that you can fill. If their follow-up is poor, make yours exceptional. If their website is confusing, ensure yours is user-friendly.
8. Financial Performance Analysis
Diving into a competitor’s financial data offers one of the most revealing competitor analysis techniques available. This quantitative method involves scrutinising a rival’s financial statements, performance metrics, and key ratios to gauge their stability, profitability, and strategic priorities. It transforms abstract competition into concrete numbers, showing you where a competitor is strong, where they might be struggling, and where they are investing for the future.
This analysis goes beyond just looking at headline revenue. It involves examining:
- Profitability: Are they making a healthy profit? Key metrics like gross profit margin, operating margin, and net profit margin reveal how efficiently they turn sales into actual profit.
- Growth Trends: Is their revenue growing, stagnating, or declining year-on-year? Consistent growth may indicate a successful strategy, while a downturn could signal an opportunity for you to capture market share.
- Investment Priorities: Where are they spending their money? Analysing their spending on research and development (R&D), marketing, or capital expenditures (like new equipment or premises) highlights their long-term strategy.
- Financial Health: How stable is their business? Ratios like the current ratio (assets vs. liabilities) can indicate if they have a healthy cash flow or are facing financial strain.
For a local retail business in Surrey, this could mean comparing your inventory turnover rate with a competitor’s. A rival with a much faster turnover might have a more effective stock management or pricing strategy. Similarly, a local hospitality venue could analyse a competitor’s reported profit margins to understand their cost control and pricing power, providing a benchmark for their own operational efficiency.
Key Components of Financial Performance Analysis
To conduct a meaningful analysis, focus on trends and industry-specific metrics rather than isolated figures. This provides context and helps you understand the story behind the numbers.
- Income Statement: Reveals revenues, costs, and profitability over a period. Look at the trends in sales growth and key expense lines.
- Balance Sheet: Provides a snapshot of assets, liabilities, and equity. This helps you assess their financial structure and solvency.
- Cash Flow Statement: Shows how cash is moving in and out of the business from operations, investing, and financing. A strong operating cash flow is a sign of a healthy core business.
- Industry Ratios: Compare metrics like Return on Assets (ROA), inventory turnover, or (for service businesses) revenue per employee against industry benchmarks and specific competitors.
Actionable Tips for an Effective Financial Analysis
- Focus on Trends: A single year’s data is just a snapshot. Analyse financial statements from the last three to five years to identify meaningful patterns, growth trajectories, and potential warning signs.
- Use Industry-Specific Metrics: A metric like ‘cost per available seat mile’ is vital for an airline but irrelevant for a local bakery. Use ratios that matter in your specific sector to get actionable insights.
- Combine with Qualitative Insights: The numbers tell you what is happening, but not always why. Combine your financial findings with other techniques, like analysing their marketing or customer reviews, for a complete picture.
- Predict Future Moves: A significant increase in R&D spending could signal a new product launch. A large capital investment might mean they are expanding. Use financial data to anticipate your competitor’s next strategic move and prepare accordingly.
9. Strategic Group Mapping
Not all competitors are created equal, and Strategic Group Mapping is a powerful competitor analysis technique that helps you visualise and understand the competitive landscape by clustering rivals into groups based on their strategies. Instead of viewing the market as one large group of competitors, this method allows you to identify distinct clusters of companies that pursue similar approaches.
This framework involves plotting your competitors on a two-dimensional map based on key strategic variables. The goal is to see which businesses are your direct rivals, which operate in different strategic spaces, and what it would take to move from one group to another. The axes of the map could represent variables such as:
- Price vs. Quality: Plotting firms based on their pricing strategy and perceived product or service quality.
- Geographic Scope vs. Product/Service Range: Differentiating between local specialists and national chains with broad offerings.
- Distribution Channels vs. Customer Segments: Comparing businesses that sell online directly to consumers versus those using third-party distributors to target different demographics.
For instance, a local restaurant in Surrey could map its competitors using “Price Point” and “Cuisine Type” as its axes. This would clearly show groups like high-end fine dining establishments, mid-range family pubs, and low-cost fast-food outlets. This helps the restaurant owner identify their immediate competition and spot unoccupied market niches. This type of strategic clarity is fundamental for anyone looking to achieve sustainable business growth.
Key Components of Strategic Group Mapping
To build a useful map, the selected dimensions must be critical to competitive success within your industry. The map reveals the “mobility barriers” – obstacles that make it difficult for a company to shift from one strategic group to another, such as brand reputation, capital investment, or established supply chains.
Actionable Tips for Effective Strategic Group Mapping
- Choose Relevant Dimensions: Select strategic variables that genuinely define the competitive structure in your market. Avoid vanity metrics.
- Keep It Simple: Use only two or three key dimensions for your map to ensure it remains clear and easy to interpret. Over-complicating it can hide the very insights you are trying to uncover.
- Analyse the Gaps: The empty spaces on your map are just as important as the clusters. They can represent untapped opportunities or unviable market positions.
- Assess Mobility Barriers: Understand what prevents competitors from easily switching groups. Could a budget provider easily move into the premium space? Analysing these barriers reveals the stability of the competitive structure.
10. Win/Loss Analysis
One of the most direct competitor analysis techniques, Win/Loss Analysis moves beyond assumptions and gets straight to the source. It is a systematic process for understanding why you win business against your rivals and, just as importantly, why you lose. By speaking directly to prospects who chose either you or a competitor, you gain unfiltered insights into their decision-making process.
This method involves conducting structured interviews after a sales decision has been made. The goal is to uncover the real reasons behind the outcome, providing invaluable feedback on your competitor’s strengths, weaknesses, and sales tactics from the customer’s perspective. It highlights how your value proposition, pricing, and product features are perceived in head-to-head situations.
For instance, a B2B software company in Woking could use this technique after a competitive bidding process. By interviewing a prospect who chose a rival’s solution, they might discover the competitor offered a more flexible implementation plan (a perceived strength) or that their own sales presentation was too technical for the decision-makers (a weakness to address). This feedback is gold dust for refining future proposals and sales strategies.
Key Components of Win/Loss Analysis
To be effective, this analysis must be structured and consistent. The focus is on gathering qualitative data about the entire buyer journey, not just the final price.
- Decision Triggers: What prompted the buyer to seek a solution in the first place?
- Evaluation Criteria: What were the most important factors they used to compare options (e.g., price, features, customer support, reputation)?
- Competitor Perception: How did they view your competitor’s offering versus your own? What were the perceived advantages and disadvantages of each?
- Sales Process Experience: How did your sales process compare to the competitor’s? Were there any key moments that influenced their decision?
By consistently asking these questions, you build a clear picture of your competitive landscape and identify recurring patterns in wins and losses.
Actionable Tips for an Effective Win/Loss Analysis
- Act Quickly: Conduct interviews within 30 days of the decision while the details are still fresh in the contact’s mind. The longer you wait, the less reliable the feedback becomes.
- Consider a Neutral Third Party: Prospects are often more candid with an independent interviewer than with the salesperson they just turned down. This can lead to more honest and valuable insights.
- Dig Deeper Than Price: While budget is always a factor, don’t let the conversation stop there. Ask “what if” questions to understand how other criteria like service, features, or trust influenced the outcome.
- Share Learnings Across Teams: The insights gathered are not just for the sales team. Share findings with marketing, product development, and leadership to inform overall business strategy and competitive positioning.
Competitor Analysis Techniques Comparison
| Technique | Implementation Complexity | Resource Requirements | Expected Outcomes | Ideal Use Cases | Key Advantages |
|---|---|---|---|---|---|
| SWOT Analysis for Competitors | Low – simple matrix-based analysis | Low – mainly qualitative data | Holistic view of competitor strengths, weaknesses | Strategic planning, gap identification | Easy to use, cost-effective, broad overview |
| Porter’s Five Forces Analysis | Medium to high – requires in-depth study | Medium to high – industry data needed | Understanding industry attractiveness and forces | Industry analysis, market entry/expansion | Comprehensive industry structure insights |
| Competitive Benchmarking | Medium – data gathering and analysis | Medium to high – access to competitor data | Identification of performance gaps and best practices | Performance improvement, target setting | Objective, data-driven comparisons |
| Digital Footprint Analysis | Medium – requires digital tools expertise | Medium – analytics tools and skills | Real-time insights on digital presence and engagement | Digital strategy assessment, marketing intelligence | Cost-effective, real-time, multi-platform insights |
| Perceptual Mapping | Low to medium – data collection & plotting | Low to medium – customer data and survey | Visual positioning and market gap identification | Brand positioning, customer perception analysis | Easy to understand, reveals visual market gaps |
| Feature Comparison Matrix | Medium – detailed data collection | Medium – requires data on features | Detailed feature gaps and competitive advantages | Product development, sales and marketing support | Detailed, easy to update, supports decision making |
| Customer Journey Mapping | High – extensive research and mapping | High – qualitative and quantitative data | Deep insights into competitor customer experience | Customer experience improvement, retention strategy | Reveals service gaps and retention tactics |
| Financial Performance Analysis | Medium to high – financial expertise needed | Medium – publicly available financial data | Objective financial health and strategic insights | Investment analysis, competitor financial strength | Quantitative, reveals financial strengths/weaknesses |
| Strategic Group Mapping | Medium – requires strategic data analysis | Medium – strategic info on competitors | Identification of competitor groups and mobility barriers | Competitive positioning, strategic planning | Simplifies complex landscapes, shows direct competitors |
| Win/Loss Analysis | High – requires interviews and data collection | High – time-intensive research process | Insights on competitive wins, losses, and decision factors | Sales strategy refinement, bid analysis | Real-world intelligence, improves sales effectiveness |
From Analysis to Action: Building Your Winning Strategy
You have journeyed through a comprehensive toolkit of ten powerful competitor analysis techniques. From the foundational SWOT Analysis and strategic overview of Porter’s Five Forces to the granular detail of a Feature Comparison Matrix and the customer-centric view of Competitor Journey Mapping, each method offers a unique lens through which to view your market landscape. We have explored how to benchmark performance, analyse digital footprints, and even map out strategic groups to understand who your true rivals are.
The core lesson is this: competitor analysis is not a one-time task to be completed and filed away. It is a dynamic, continuous process that fuels strategic decision-making. The real power of these frameworks is unlocked not in the gathering of data, but in the synthesis of insights and the translation of those insights into decisive, intelligent action. For a small business in Surrey or the South East, this means moving from simply knowing what a local competitor does to understanding why it works and how you can create a superior alternative.
Key Takeaways for Your Business
To truly gain a competitive edge, focus on these central principles:
- Move Beyond Observation: Don’t just collect data; interpret it. A competitor’s high ranking on Google isn’t just a fact, it’s a clue. What keywords are they targeting? What kind of content are they creating? Each data point is a starting block for deeper investigation.
- Combine and Conquer: The most robust insights emerge when you combine several competitor analysis techniques. Use a Digital Footprint Analysis to identify a key competitor, then apply a SWOT analysis to understand their internal strengths and weaknesses. The sum of these parts provides a much richer, more three-dimensional picture.
- Focus on Actionable Outcomes: Every analysis should end with the question, “So what?”. If a competitor has a feature your customers are asking for (revealed by a Feature Comparison Matrix), the action is to evaluate its feasibility for your own product or service. If Win/Loss Analysis shows you are losing deals on price, the action is to either adjust your pricing or better articulate your value proposition.
- Make it a Habit: Markets change, competitors evolve, and customer preferences shift. Schedule regular competitor reviews, perhaps quarterly or bi-annually. Making this a routine part of your business operations ensures you are never caught off guard and can adapt proactively, not reactively.
Mastering these competitor analysis techniques will empower your business to stop guessing and start strategising. You will be better equipped to anticipate market trends, refine your unique selling proposition, identify untapped opportunities, and ultimately, build a more resilient and profitable business. The knowledge is now yours; the next step is to put it to work.
Frequently Asked Questions (FAQs)
1. How often should a small business conduct a competitor analysis?
For most small businesses in dynamic sectors like retail or hospitality, a comprehensive review every six months is a good benchmark. However, you should continuously monitor your closest competitors’ digital activities (e.g., social media, new Google reviews) on a monthly or even weekly basis to stay agile.
2. Which technique is the most important for a local service business?
A Digital Footprint Analysis is arguably the most crucial starting point. For local businesses, online visibility is paramount. Understanding how competitors rank on Google, what their Google Business Profile looks like, and what local directories they are listed in provides immediate, actionable insights for improving your own local SEO.
3. I’m a sole trader with very little time. Where should I start?
Start with a simple Feature Comparison Matrix or a basic SWOT Analysis of your top two local competitors. These methods are relatively quick to implement and provide clear, high-impact insights. You can compare your service offerings, pricing, and perceived strengths directly against theirs to find immediate areas for improvement.
4. Can I do competitor analysis without expensive tools?
Absolutely. While paid tools offer deep insights, you can accomplish a great deal for free. Use Google searches in “Incognito” mode, browse competitor websites and social media profiles, read their customer reviews, and use free tools like Google Alerts to track their mentions. The key is consistent effort, not a big budget.
5. What is the biggest mistake businesses make with competitor analysis?
The most common mistake is “analysis paralysis,” where businesses gather vast amounts of data but fail to act on it. The goal is not to create a perfect report; it is to find a handful of key insights that can inform a specific strategic change, whether that’s updating your website, launching a new marketing campaign, or refining a service.
Turning these analytical insights into tangible growth requires expertise and execution. If you’re ready to translate your competitor research into a dominant online presence through strategic SEO and a high-performing website, the team at GFC Tech can help. We specialise in empowering local businesses to outmanoeuvre their competition and win in the digital space.
Get in touch with GFC Tech to build your winning strategy
Adam is a Founder of GFC Tech, a company dealing in SEO and website design and development services. Adam has been an SEO expert for the past 8 years and has been working with different companies in this field. He is an SEO consultant and a marketing strategist and works closely with his clients to ensure that his marketing plans and strategies provide them with the marketing advantages they need to grow their business. Adam’s main role is an SEO consultant, but he is also involved in all technical aspects. Adam also develops WordPress websites, designs them professionally and performs SEO for them so they can rank on the first page of google.


